

Severe Asthma


Overview
The Severe Asthma Index is a data-driven tool that enables countries to explore national variation and gaps in care in support of driving policy action to address the unmet needs of people with severe asthma. Raw data collected from desktop research and the questionnaire were matched with each of the validated indicators and then organised into the approved indicator categories.
Severe Asthma Facts
For the year ended 2019
Severe Asthma
€380 billion
European Respiratory Society reported that respiratory diseases cost the European Union more than €380 billion annually
Severe Asthma
461,000 deaths
According to the World Health Organization Severe Asthma affects 33.4 million people and 1.3% die from a preventable disease.
Severe Asthma Best Practices
Explore best practices in severe asthma care, focusing on innovative approaches that combine cutting-edge treatments with personalized patient management strategies
Reporting on severe asthma varies greatly across countries
A “whole system” approach to manage severe asthma is needed
Where Does Your Country Rank?
Following normalisation, country scores for each indicator category were averaged and then multiplied by 10 to give a score out of 100 points.
Ranking
P
A
H
D
E
SCORE
1

Italy
14
12
3
12
25
71
2

Australia
3
6
30
44
1
71
3

United Kingdom
7
1
35
43
6
71
4

France
1
11
16
35
17
70
5

Sweden
8
10
21
38
18
70
6

Poland
18
20
4
23
7
69
7

Denmark
20
4
26
16
24
68
8
New Zealand
6
22
38
40
3
68
9

Norway
2
16
20
37
9
68
10

Lithuania
10
34
2
14
22
67
11

Austria
22
5
10
24
14
67
12

Hungary
22
8
5
27
21
66
13

Greece
10
37
1
29
27
66
14

Spain
29
9
18
21
19
66
15

Slovakia
28
24
6
28
4
66
16

Portugal
15
26
17
36
30
65
17

Romania
16
13
12
25
43
65
18

Switzerland
21
18
19
39
5
65
19

Canada
27
19
30
15
37
64
20

Finland
13
31
25
33
20
64
21

Ireland
5
28
37
45
10
64
22

Israel
33
2
32
20
40
64
23

Netherlands
38
3
22
34
15
63
24

India
9
35
40
10
34
62
25

Republic of Korea
40
25
13
8
23
62
26

Brazil
19
33
34
5
38
61
27

Germany
32
14
24
19
16
61
28

China
25
15
28
2
41
61
29

Colombia
12
41
43
1
33
60
30

Chile
16
36
44
30
2
60
31

Mexico
4
45
45
7
32
60
32

Estonia
37
31
8
11
31
60
33

Japan
39
38
13
6
12
59
34

Czechia
35
21
7
32
13
59
35

Belgium
43
17
11
31
11
58
36

Kingdom of Saudi Arabia
26
29
27
22
45
58
37

Peru
34
44
28
3
36
58
38

Costa Rica
24
43
39
4
26
58
39

United Arab Emirates
31
27
23
41
35
58
40

South Africa
30
42
42
13
28
56
41

Slovenia
42
30
36
9
29
54
42

Argentina
36
40
41
18
8
53
43

Latvia
44
23
15
17
39
52
44

Cyprus
45
7
9
42
42
52
45

Egypt
41
39
32
26
44
51
Severe Asthma Data Takeaways
What we found from our study into Severe Asthma
Health System
There are over 90 severe asthma hospitalisations per 100,000 people between the top and bottom scorers
Disease Burden
New Zealand has x16 the rate of estimated severe asthma deaths compared to the highest-scoring country, Lithuania
Severe Asthma Steering Committee
The Severe Asthma Index is validated by a six-member external independent Steering Committee of experts in the respiratory and health policy spaces.

Professor Vibeke Backer, MD DMSci
Chief Respiratory Physician at Department of ENT and Centre for Physical Activity Research (CFAS), Rigshospitalet, Copenhagen, Denmark

Sir David Behan
Chair Health Education England, NHS, UK

Mark Levy
Board Member, GINA, UK

Prof. Dr. Arzu Yorgancıoğlu
Chair ERS Advocacy Council; GINA Board President; Chair of GINA Dissemination and Implementation Committee; Chair of the WHO GARD Executive Committee Turkey

Mikaela Odemyr
Chair ELF Patient Advisory Committee; Chair Swedish Asthma and Allergy Association, Sweden

Susanna Palkonen
Director, EFA; EU
Data scoring and normalisation
Raw data collected from desktop research and the questionnaire were matched with each of the validated indicators and then organised into the approved indicator categories. Qualitative data points were quantified through the application of scorecards designed by the research team. The scorecards associate different point values to a set of standardised qualitative characteristics, for example, whether a country has a set of national guidelines for severe asthma care. Indicators based on qualitative data have scorecards with different maximum values; these values depend on the characteristics being examined in the Severe Asthma Index.
Several qualitative indicators are dichotomised in the Index, i.e., 1 point may be assigned if a given condition is fulfilled, while a score of 0 is assigned if the condition is not fulfilled.
Following the scoring of the quantitative data, all data points in the Index were normalised on a 0 to 10 scale using a min-max normalisation method. This approach allows for uniform analysis of many different types of data that have originally been recorded on different scales. On the normalised scale, a score of 10 indicates a high level of fulfilment of the Index model’s criteria for a given indicator, while a score of 0 indicates a low level of fulfilment.
Following normalisation, country scores for each indicator category were averaged and then multiplied by 10 to give a score out of 100 points. The conversion to a 100-point scale on the category level is to reflect smaller differences in country performance that would otherwise be expressed as decimals.
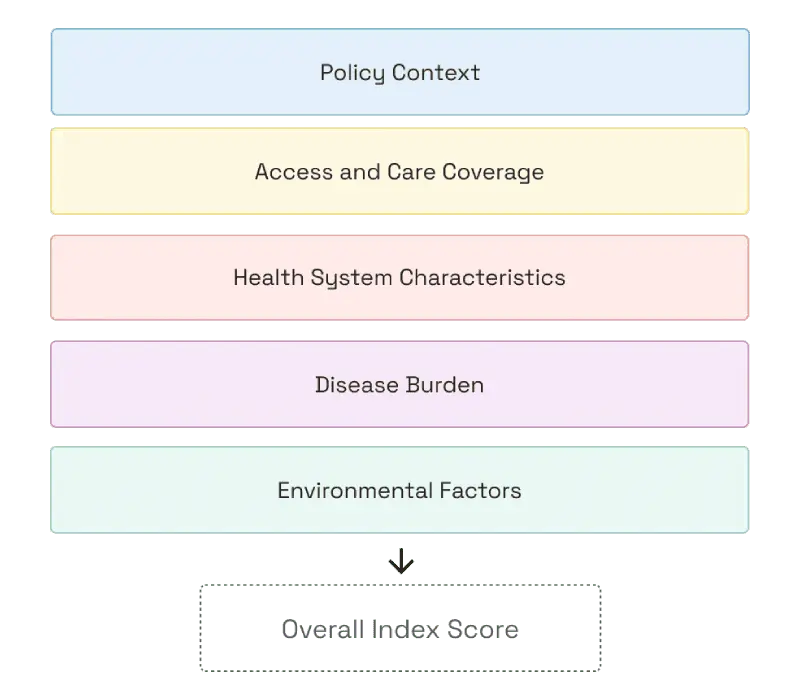
To produce an overall Index score, country performance in each of the indicator categories was averaged and weighted. The following weights were applied to each indicator category when calculating the overall Index score for each country:

Index Score Weighting
The weighting approach emphasises elements of the Index that can be directly addressed by decision makers and stakeholders.
Weighting
The weighting approach emphasises elements of the Index that can be directly addressed by decisionmakers and key stakeholders/stakeholder groups. The Policy Context and Access and Care Coverage categories are therefore more heavily weighted in the Index because they include indicators that directly reflect or are expressions of conditions over which country decisionmakers and stakeholders have control.
The remaining categories in the Index are less heavily weighted because they are either linked to longer-term health outcomes and health system performance and/or indirect factors impacting severe asthma management and outcomes. The assigned weights aim to reflect the Index’s primary ambition to motivate policy actions and adoption of best practices that should improve health outcomes, health system performance, and ultimately address factors affecting the prevalence and severity of asthma among populations.
Overall Index Score
The weighting approach emphasises elements of the Index that can be directly addressed by decision makers and stakeholders.
Important note on scoring in the Severe Asthma Index data model
The Severe Asthma Index is constructed as an ideal and abstract model for severe asthma care and management. In this way, no country is expected to receive a perfect score in the Index. Crucially, the scoring system should not be understood as an expression of how objectively “good” or “bad” a country health system is at managing and preventing severe asthma. Rather, the overall Index score and category scores should be understood as indications of how well country health system approaches and performance concerning severe asthma fit the ideal model that the Severe Asthma Index proposes.
Limitations
The Severe Asthma Index is a powerful tool for identifying best practices in severe asthma care and analysing country health system performance against an ideal model for severe asthma care, but it is still bounded by several important limitations that must be kept in mind when exploring the Index insights and the data on which they are built:
Data availability and accuracy
There are significant limitations on availability and accuracy of severe asthma-related data. In many cases, there is a lack of disaggregation in health data indicating asthma severity. Therefore, several sources of information may be used to build the dataset for a single indicator.
Time lag and time series
Inclusion of many different kinds of data in the Index has necessitated the use of data that has been collected at different periods in time. The Index makes use of the latest data wherever possible, but there is still variance in the time series within and across indicator data. Differences in time series in the dataset are always indicated on the Index.
Missing data and imputation
Data points for some countries are not reported or non-existent. In such instances, data has been imputed by calculating the average value for the given indicator using the reporting countries’ data. Imputed values are always indicated in the Index.
Proxy indicators and conceptual accuracy
Several proxy indicators have been developed to approximate data that are not currently directly reported. These proxy indicators may in some cases be based on a composite of several variables. Proxy indicators and their method of calculation are always listed in the Index.
Generalisation
The whole-country approach of the Severe Asthma Index may risk generalising intra-country differences such as urban/rural divides and differences in regional approaches to care, especially in federalised countries and countries with highly devolved healthcare systems.
COVID-19
Several data points may be influenced by the impact of the COVID-19 pandemic on health system capacity, performance, planning, and access.
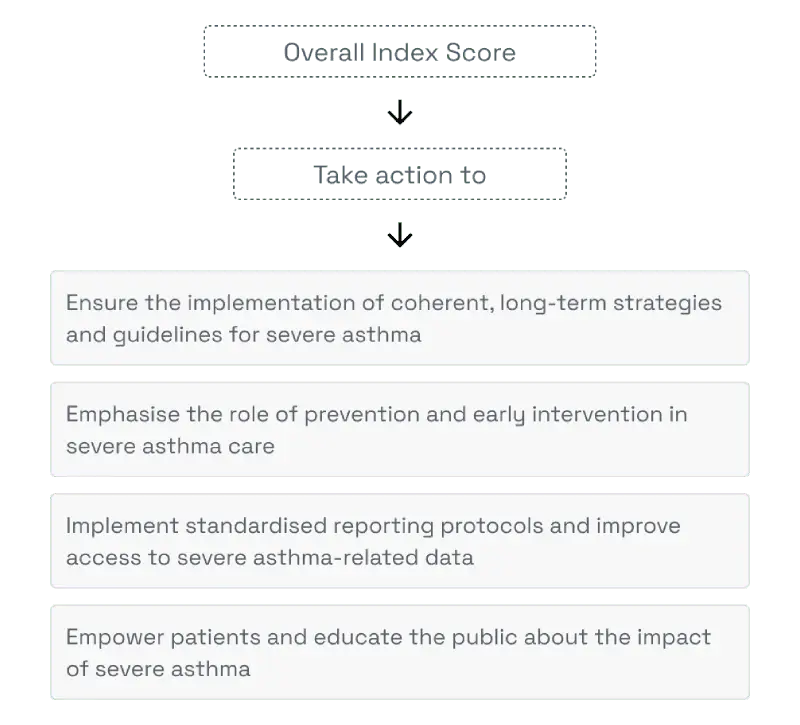
The Index Goal
To give change makers the information they need to take action toward improving the standard of care in severe asthma.